From Andrew Hill, taking the 1st wicket in the history of Test Cricket by uprooting the stumps of Nat Thomson to James Anderson taking his 667th wicket by grabbing the catch of Kyle Verreynne on his bowling.
From the Australian new ball combination of Lindwall-Miller destroying opponents to Wasim/Waqar and now Bumrah/Shami doing the same.
Dynamics have changed, and so has test cricket; what hasn’t changed since the inception of this format is the power of fast bowlers to win games on their own.
They are still as vital as they ever were in this game, always the most influential category of players in this format.
Now, the curiosity of comparison arises, and so does the question, “Who is the greatest fast bowler in test cricket since the game’s inception till almost the end of 2022?”
As the conditions have changed throughout the years, comparing raw data of two pacers who played in entirely different periods/circumstances is not an ideal way to obtain the answer.
To solve this query or to find the actual answer to the question, I have analyzed every fast bowler with a minimum of 200 Test Wickets (57 pacers as of the date of writing this article) through my own metrics, which are adjusted according to the circumstances/era in which the fast bowler has played.
Factors/Metrics Considered:
- Wickets Per Innings (Overall/Away)
- Adjusted Bowling Average/Average Ratio (Overall/Away)
- Support Index Average (Overall/Away)
- Adjusted Strike Rate/Strike Rate Ratio (Overall/Away)
- Support Index Strike Rate (Overall/Away)
Some rigid requirements would apply regardless of the player name in each factor; pacers with numbers below those requirements will be disqualified.
Disqualification doesn’t always mean that the player is not a great pacer or that his data in other metrics will not be calculated. Eliminated pacers are just out of contention in the debate of the Greatest Test Pacers; hence they will not be discussed in the last point/graph.
Wickets Per Innings (WPI)
In an ideal case, the essential criterion for winning a test match is to take 20 wickets off the opposition’s batting lineup.
In our analysis of 57 selected fast bowlers, an average Fast Bowler takes “2.13” wickets per innings, and this varies a lot from 1.07 (Kallis) to 2.87 (Hadlee).
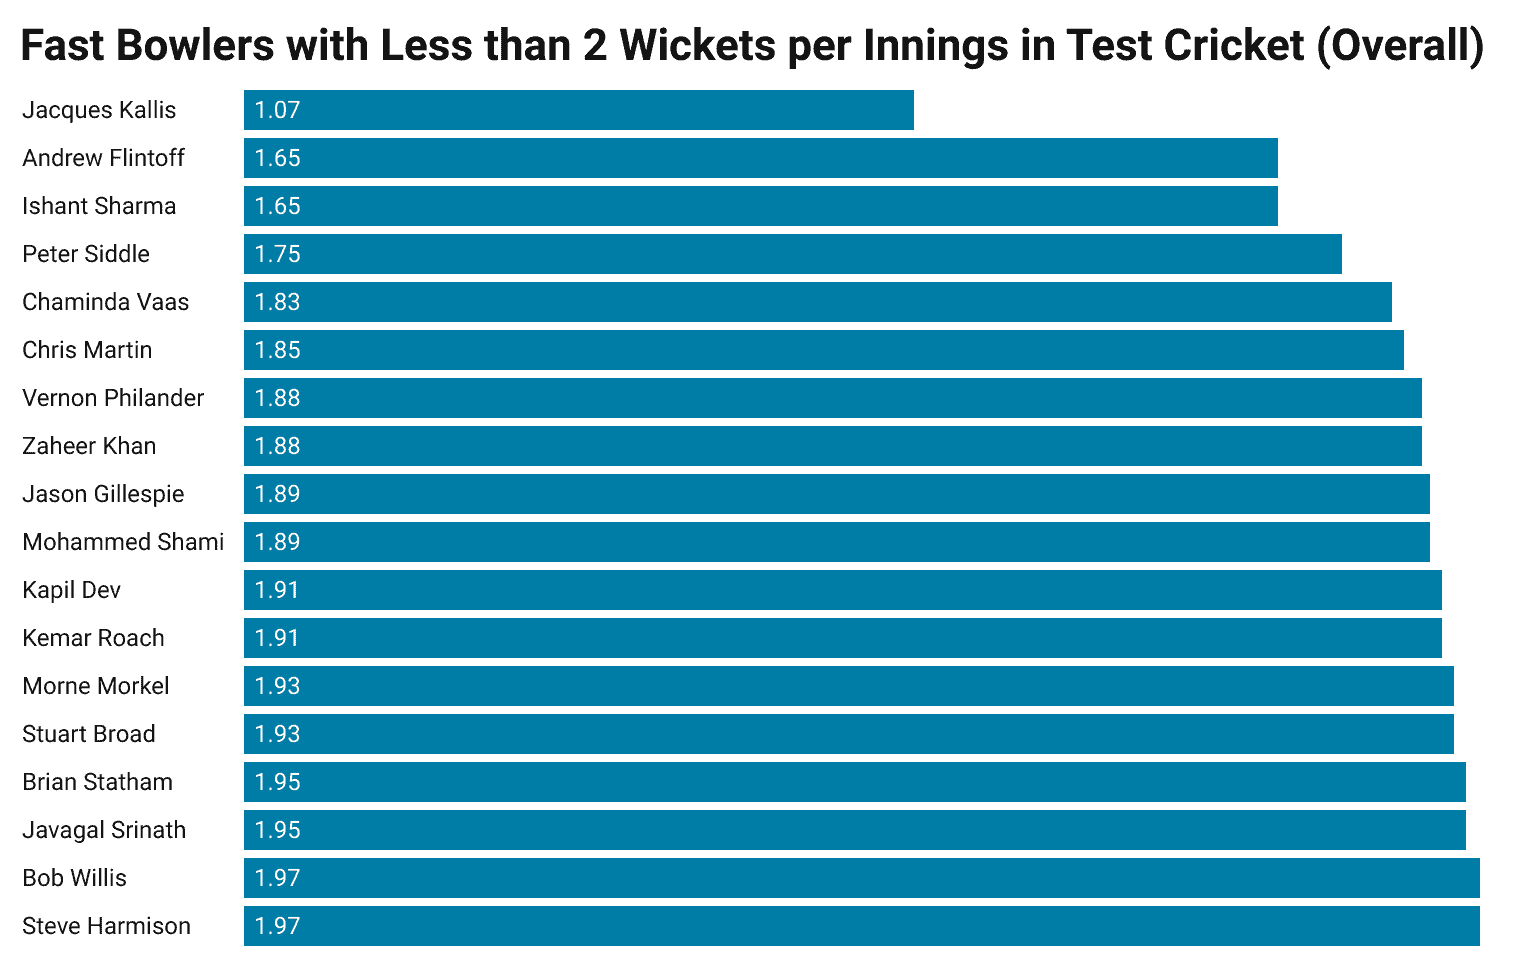
- 18 Fast Bowlers (31.6%) take less than 2 wickets per innings
- 7 Pacers (12.3%) in our list grab more than 2.5 wickets per innings
Overall
As the name states, it includes every match the player has played.
The requirement to be selected for the final contention (or not to get eliminated) is that the player should take 2 Wickets Per Innings in his overall career. Any Player who fails to fulfil this criterion can not be considered for the tag of “Greatest Fast Bowler of All Time in Test Cricket”. The list of eliminated players is given below:
Away
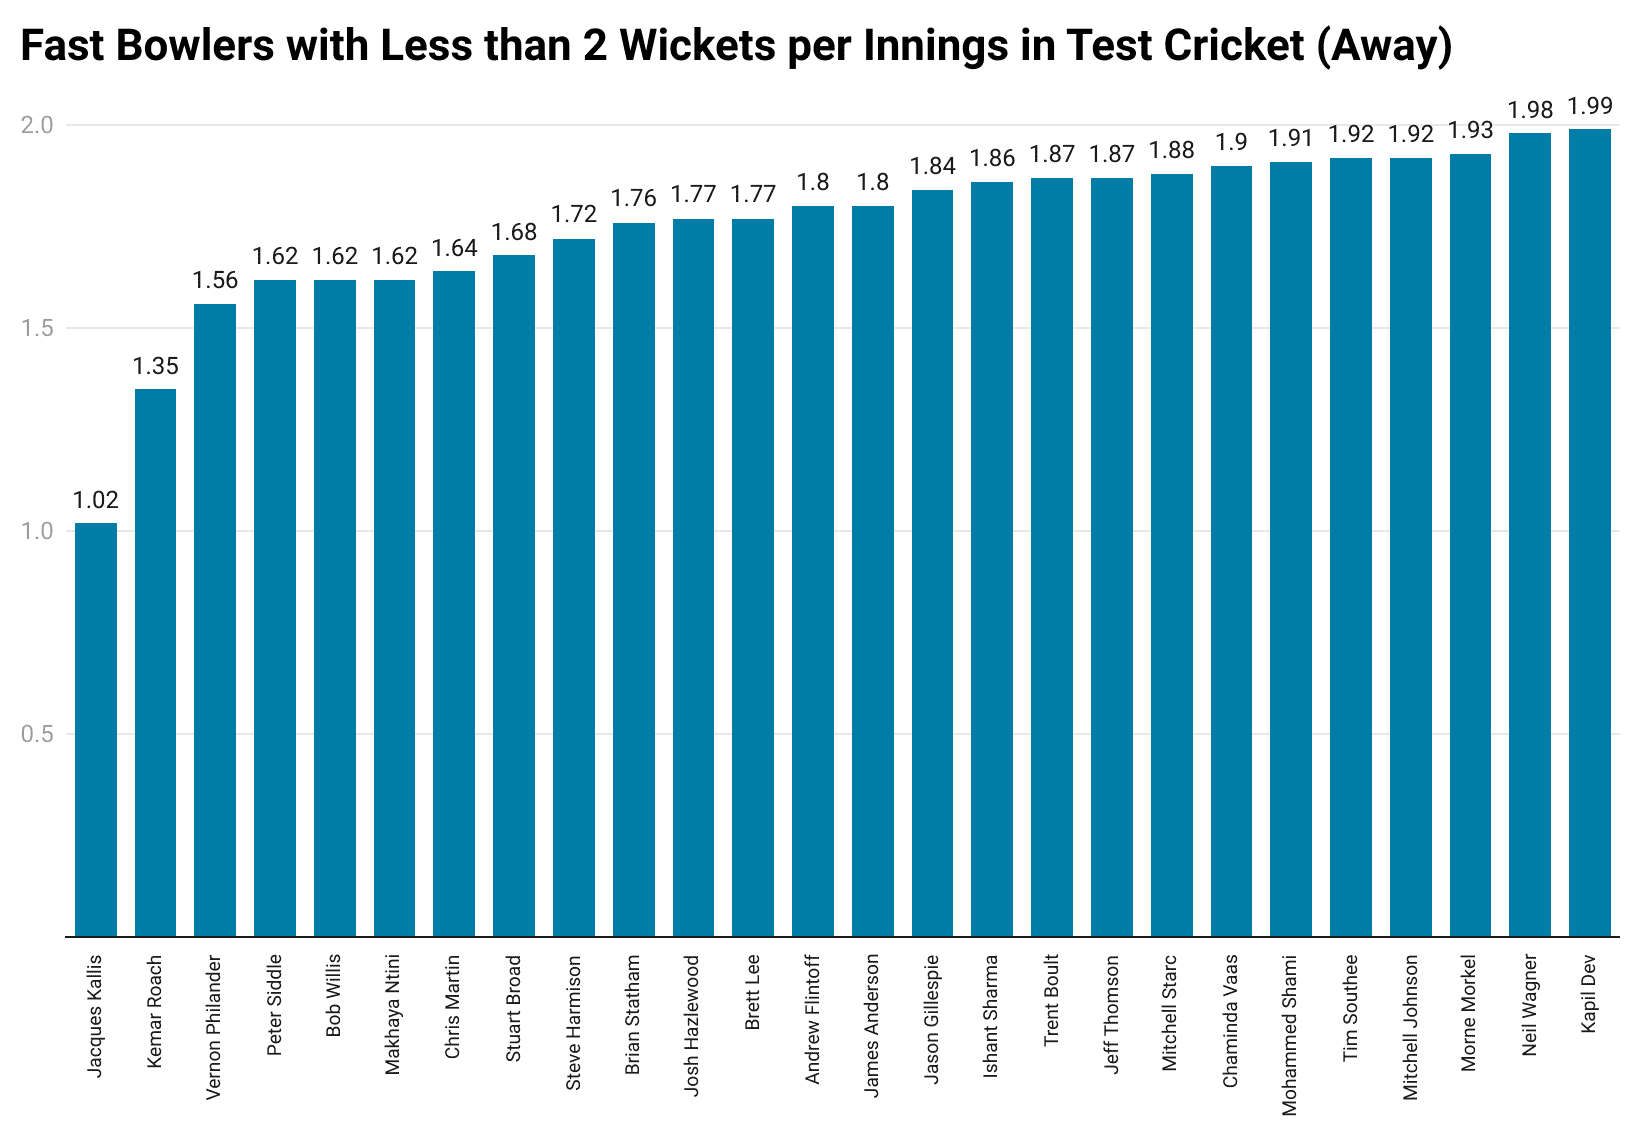
This case only considers the away games the pacer has played, and even in these games, players should fulfil the same requirement as the overall one. The list of Players with less than 2 Wickets Per Innings in away conditions is given below:
Adjusted Bowling Average/Average Ratio
As stated, taking 20 wickets is a factor, but what if both sides have achieved this in the same match? Then the team which has given the least number of runs for taking 20 wickets will win.
Bowling average becomes an essential factor for judging bowlers, and it’s especially important in the current scenario, where taking 20 wickets off the opposition lineup is not a rare thing, considering the quality of bowling attacks.
The Adjusted Bowling Average or Average Ratio is derived by comparing the averages of other pacers in the matches played by that particular player. As for Steyn, we will analyze his average and the mean average of all the other pacers (including pacers in his own team) who played in the matches he has played, and then the same procedure is done for every fast bowler.
After this step, we will obtain a ratio of other players’ average to that particular player (in our case, Steyn), as the higher the ratio, the better the bowler.
Overall
A ratio of less than 1 is considered below average because it shows that the particular bowler’s averages are higher than the mean average of pacers in the matches he played. A ratio from 1 to 1.19 is considered good/average, and a ratio of 1.2 or above can be considered an extraordinary achievement.
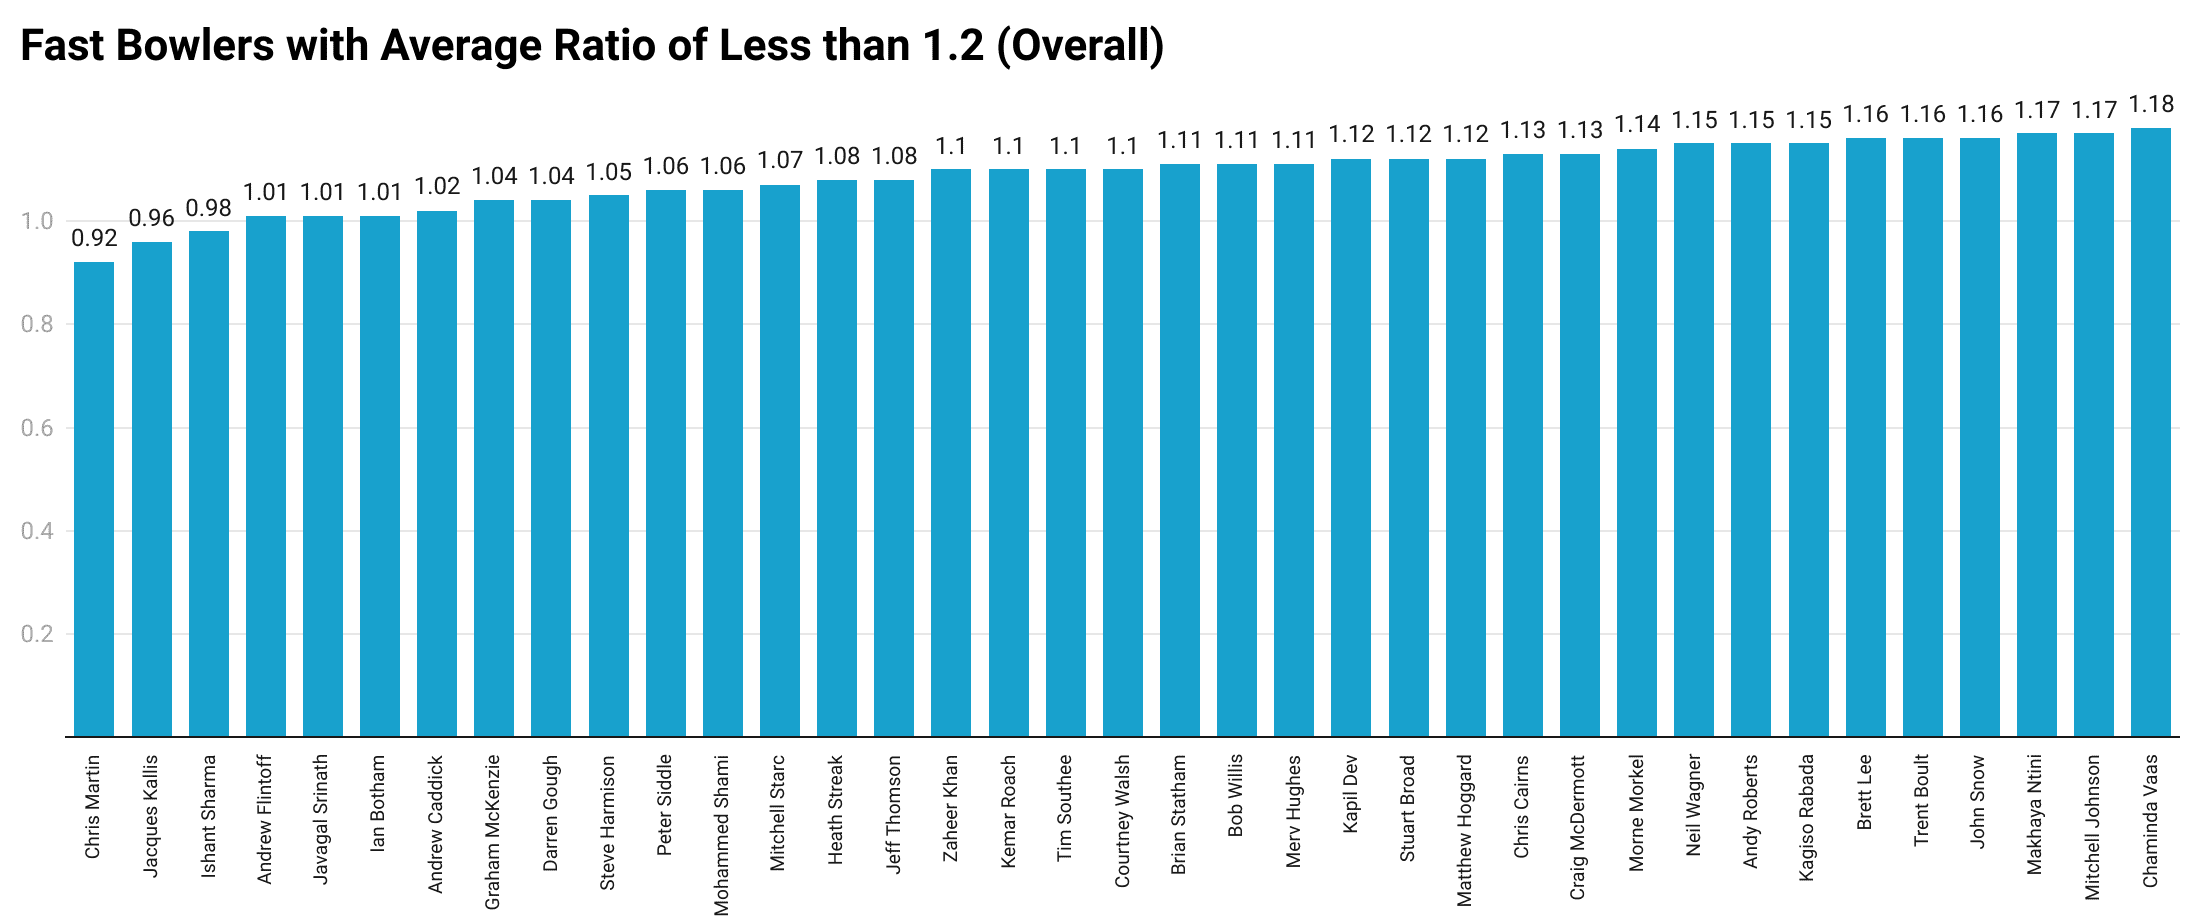
Considering the importance of this metric, we have disqualified even the pacers qualified as Good/Average. So, only fast bowlers with an average ratio of 1.2 or more are qualified. The list of pacers with an overall average ratio of less than 1.2 is given below:
Away
The same method of Average Ratio will be considered while evaluating the matches away from home for that fast bowler.
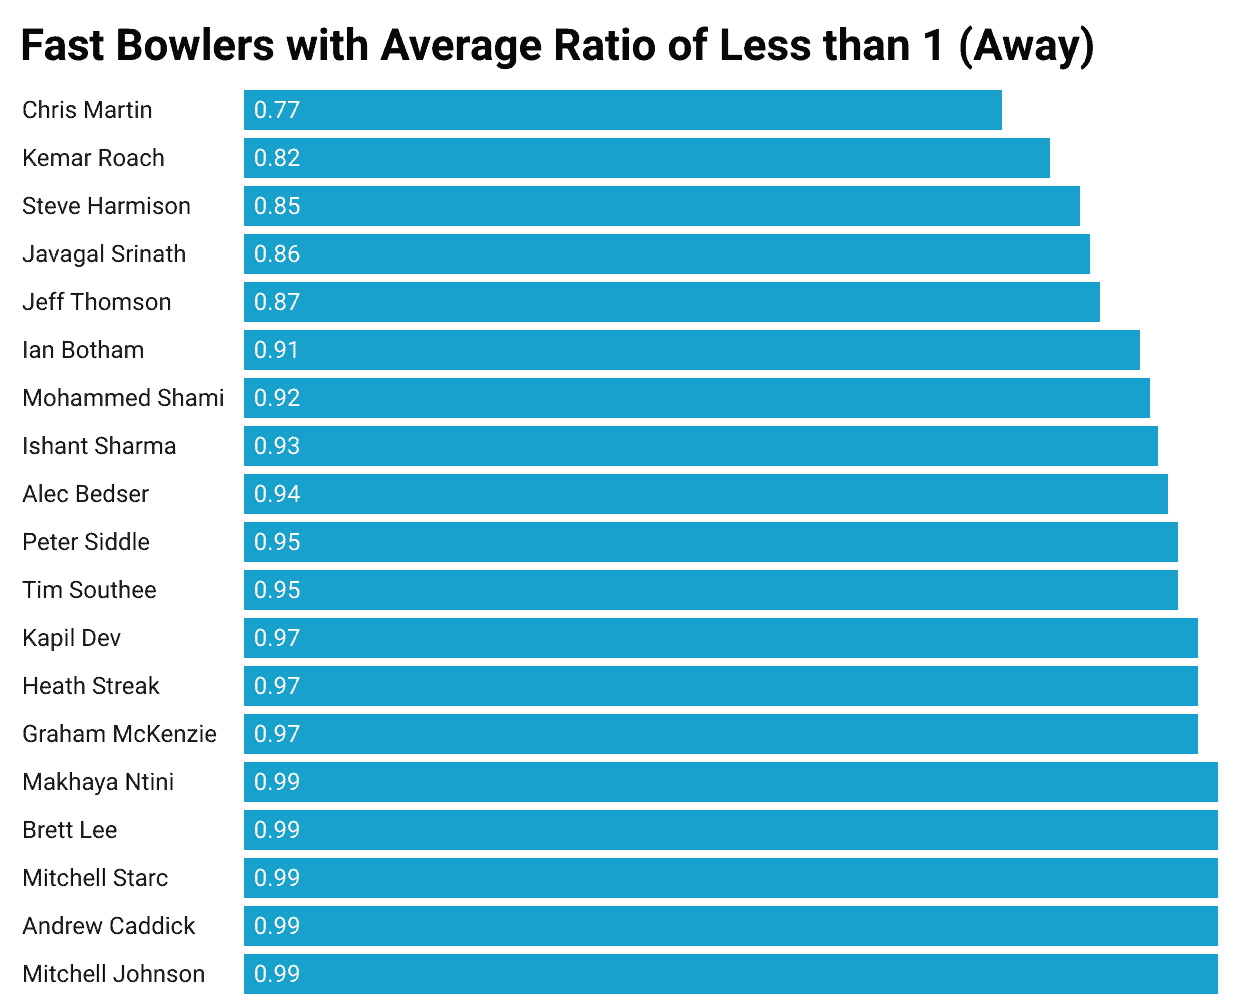
The significant difference in away if compared to the overall average ratio is that only a pacer with an away average ratio of less than 1 will be disqualified, unlike the previous one where the minimum requirement is 1.2
Support Index (Average)
Good support from the team’s pacers can boost the individual’s numbers to some degree, which although not that important, is still a metric to consider. The Support Index (Average) is quite similar to the ratio obtained in the Adjusted Average; it just takes the mean average of other pacers in the team instead of considering all the pacers playing in that match, including opposition pacers.
A Support Index Ratio of less than 1 means the player average is even worse than the mean average of his team pacers (except him), which in the case of a bowler taking 200 wickets is just below average or, say, poor.
A ratio of 1-1.2 shows that the player is a better pacer than his other teammates, but not on an extraordinary level.
A number higher than 1.2 in this index signifies that the bowler is much better than his teammates, which indicates that the support he received was inadequate or below that of the players in the above 2 categories.
Overall
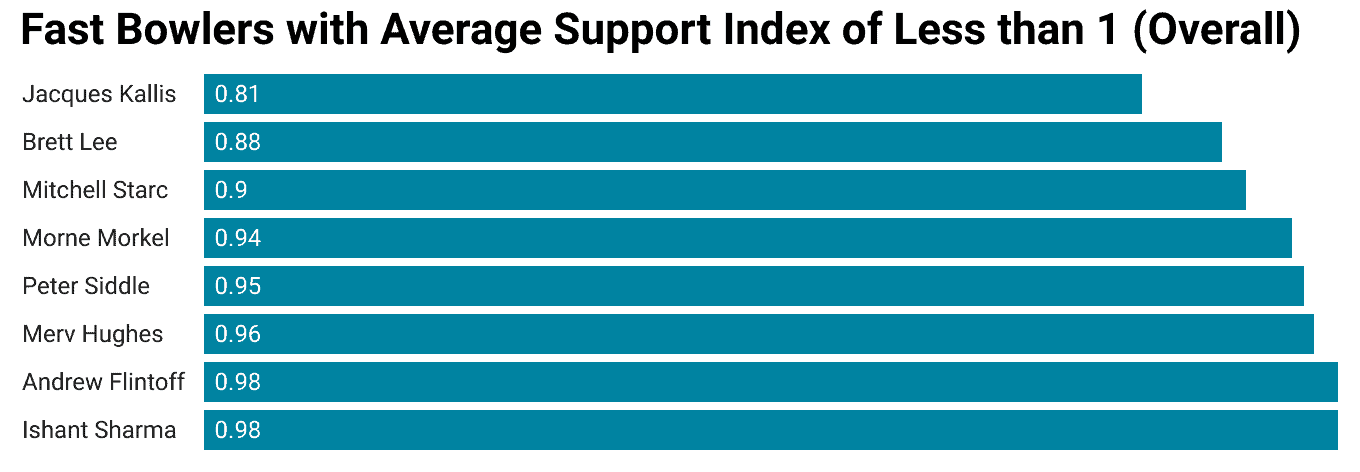
Overall Numbers will be considered, and any fast bowler with a Support Index Average Ratio below 1 is eliminated. Total 8 players fall in this category, and their names, along with their ratios, are given below:
Away
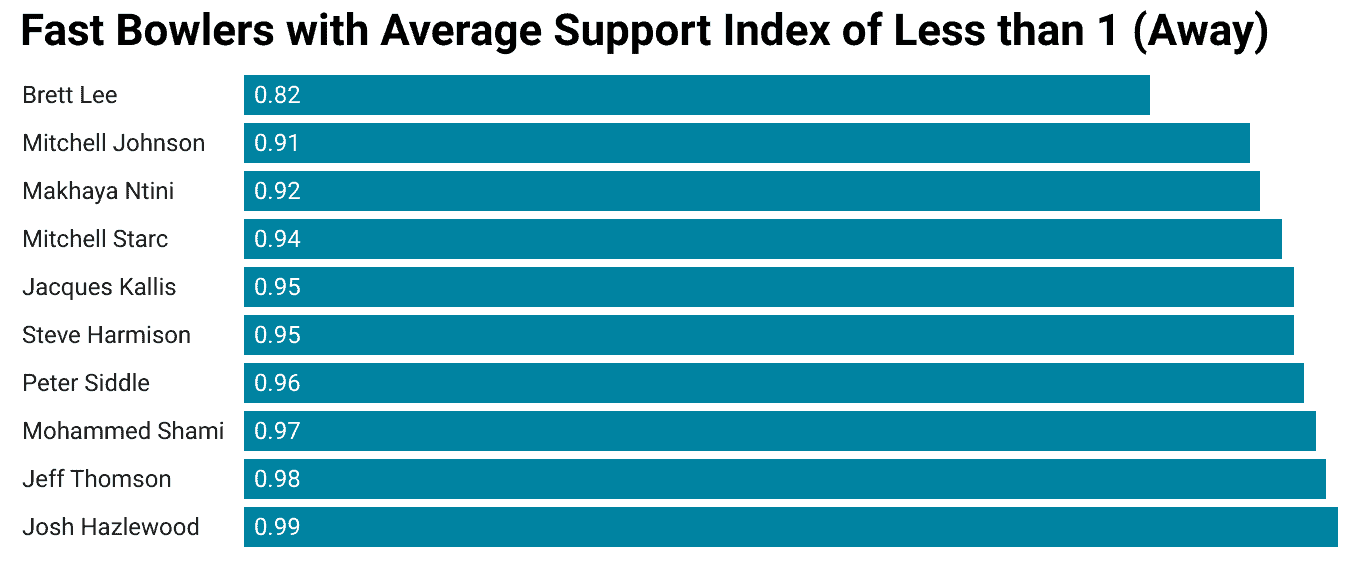
Only matches played away from a pacer’s home country are considered for this calculation. Everything else is the same as overall; the list of pacers with an Away Support Index Average Ratio of less than 1 is given below, along with their ratio values.
Adjusted Strike Rate/ Strike Rate Ratio
How many wickets can a player take? WPI clearly defines that.
How many runs would a player give for each wicket or to dismiss a team? Bowling Average Shows that.
But, the number of balls taken to dismiss a lineup is also essential, though not as much as those mentioned above, but it still holds a substantial value. It can be the difference between a draw or a match with a result.
As we don’t want to compare the raw strike rate of pacers playing in entirely different conditions, we will take the Adjusted Strike Rate into account.
This method and its criteria are the same as the average. Any number less than 1 is just below average, from 1 to 1.2 is moderate, and anything above that is sheer brilliance.
Overall
Calculated with the Overall Numbers of a pacer, which means every match the player has played is considered in the dataset to obtain the overall strike rate ratio.
As applied in most other metrics, anything less than 1 is not considered for the final conclusion and the name of disqualified pacers with their SR Ratio values is shown below:
Away
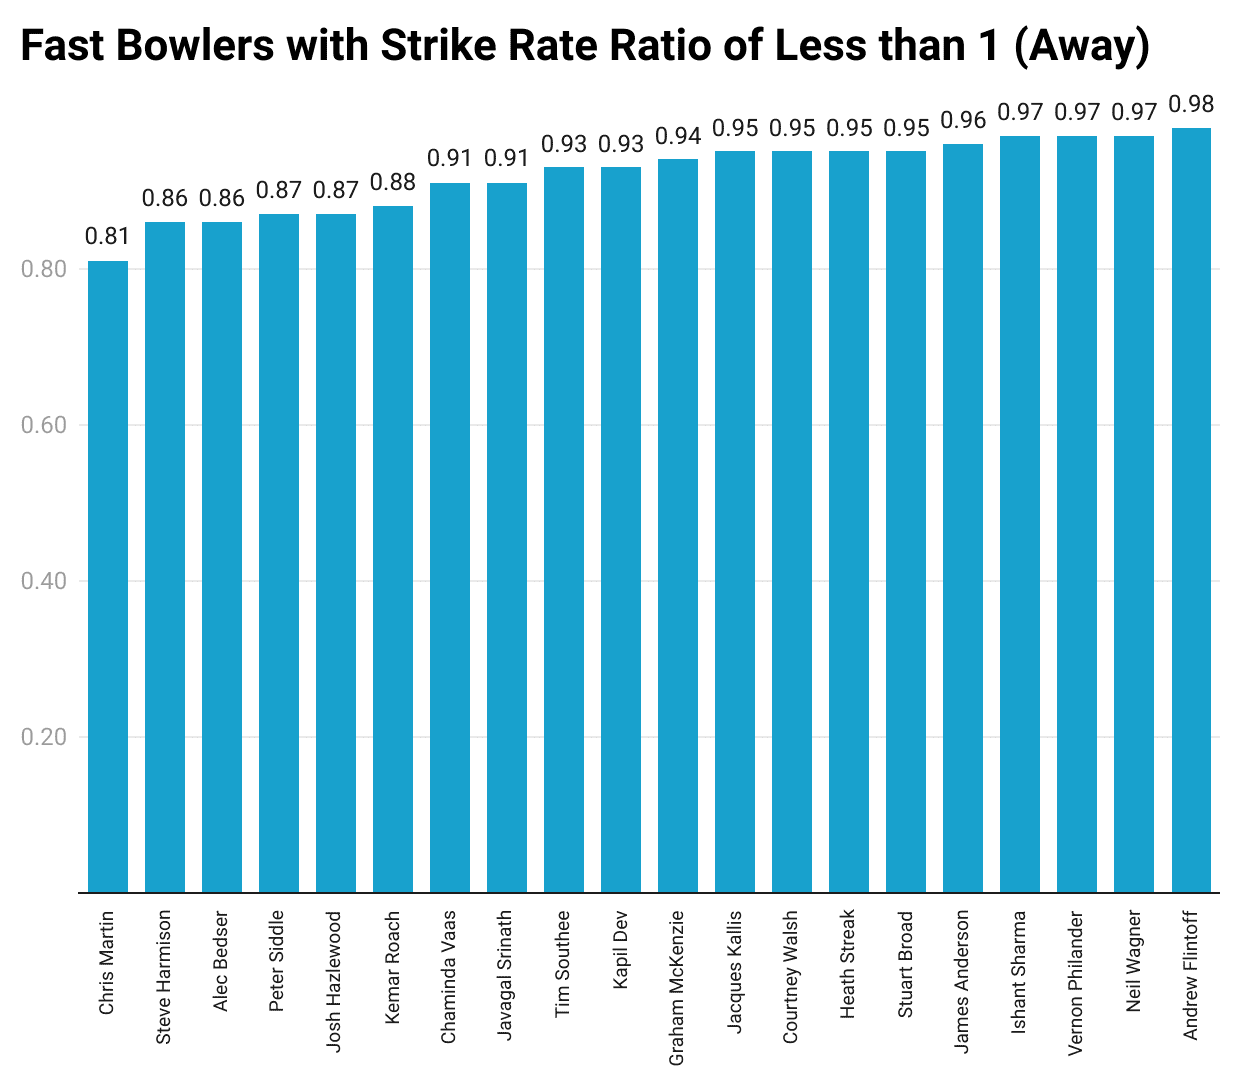
Only the dataset of away matches (anything except the home country of that pacer) will be considered. Fast Bowlers with an Away SR Ratio of less than 1 are disqualified, and their names with their ratio values are given below:
Support Index (Strike Rate)
Similar to the ratio derived in the Support Index (Average), it is the ratio of a particular player’s strike rate to the mean strike rate of other pacers in his team (Only considering the pacers played in matches he played).
The fundamental numbering is the same: 0-1 (below average), 1-1.2 (moderate), and anything above 1.2 means the pacer is either extraordinarily brilliant or he gets too little support from his other peers.
Overall
It considers every match the player plays irrespective of the conditions/countries in which the game is played.
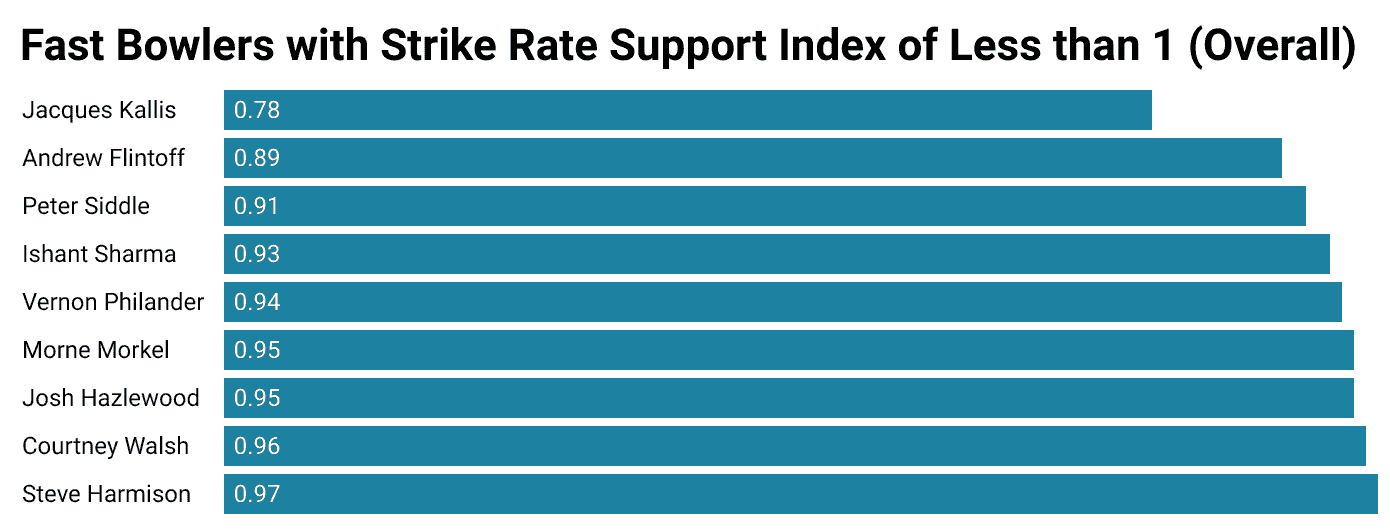
Like the criteria of most metrics, anything less than 1 is not in contention for the final list and is disqualified.
Away
In away conditions (playing in countries excluding home), this ratio is still applicable with the same fundamentals. It just considers only away matches played by a player in the data.
Here again, if a particular player is worse than the average bowler in terms of strike rate (away strike rate ratio<1) would be disqualified.
Final 15: The Qualified Ones
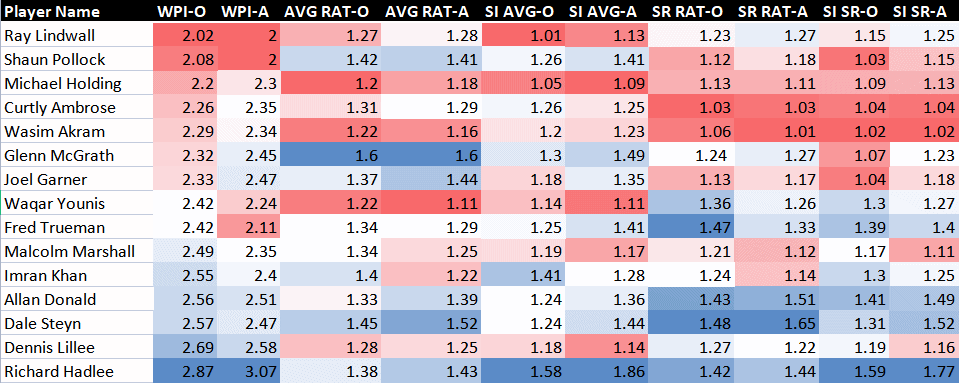
We start the analysis by taking each fast bowler with more than 200 wickets into consideration (57 at the time of start). Now, after disqualifying many pacers through 10 different parameters, we are left with a list of 15 pacers who have fulfilled each criterion in all the metrics. The list of these final 15 Fast Bowlers with their numbers in all 10 metrics is given below:
Key Observations:
- Richard Hadlee takes the most wickets per innings in both overall and away conditions.
- Glenn McGrath, if compared to the average pacer in the matches he played is 1.6 times better than an average fast bowler both overall/away.
- Dale Steyn takes wickets 1.48 times faster (in fewer balls) than an average pacer and the same ratio goes to 1.65 in away games.
- When it comes to getting low support/being better than the rest of the team pacers, no one is near Richard Hadlee (either in terms of average or strike rate).
Conclusion
Hadlee tops the WPI chart along with McGrath being the best pacer in terms of average ratio. But the lack of support from his fellow pacers gives an extra edge to Hadlee, so we conclude him as the Greatest Fast Bowler of All Time in Test Cricket with McGrath holding the second spot.
Also, whenever there would be a debate on the Greatest Fast Bowler with Strike Rate as its main criterion, Dale Steyn would easily dwarf his competitors. Malcolm Marshall is also in the race as the quality of the Fast Bowling unit he played with deprived him of a higher WPI. So, anyone of Steyn and Marshall gets the third position, with the other being at the 4th place.



Worth reading it.