Weighted Batting Average, What is it? Why is it used? How to calculate it?? After reading this article, all your questions regarding Weighted Batting Average will be sorted.
In this article, I will try to explain the metric which we will use in our upcoming comparison/analysis-based articles.
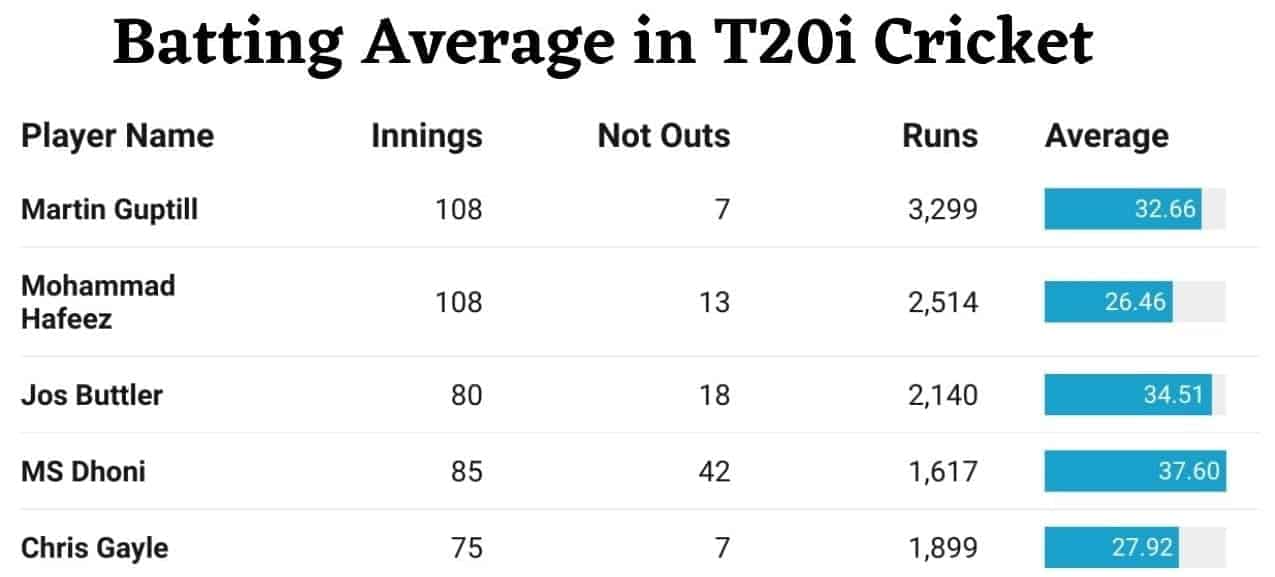
Till now, In this world of constant comparisons, You must have been using Average and RPI to compare/judge batsmen in all the formats of the game. Let’s discuss these two metrics first.
We will analyze 5 different players’ T20i careers with completely different roles in this article to compare all three analytical parameters. All these players have a varied number of not-outs.
These 5 players are Martin Guptill, Chris Gayle, Mohammad Hafeez, Jos Buttler, and MS Dhoni.
Batting Average: Fully Explained
Batting Average= Overall Runs/ (Career innings-Innings in which batsman remained not out)
As you can see, The Batting Average supports Dhoni and Buttler here, the players with higher no. of not-outs as compared to others, especially Gayle and Guptill. Now opening batsmen such as Gayle and Guptill in our comparison, have fewer chances to remain not out if compared to middle-order batsmen.
As its formulas exclude all the innings (in which the batsman remained not out) during division, it will surely give an advantage to someone like MS Dhoni, as the runs scored by him in that 42, not-out innings (where he remained not out) will be included in overall runs but the innings will be excluded during the division.
That means all the runs he scored in those 42 innings, will remain an extra bonus for him, which is totally unfair.
For example, even innings like Kohli’s 93* against WI will not be included during division, but that 93 runs will not be subtracted; Quite Flawed.!!
This is the major drawback of averages, as they give an unfair advantage to middle-order batsmen and finishers over top-order players.
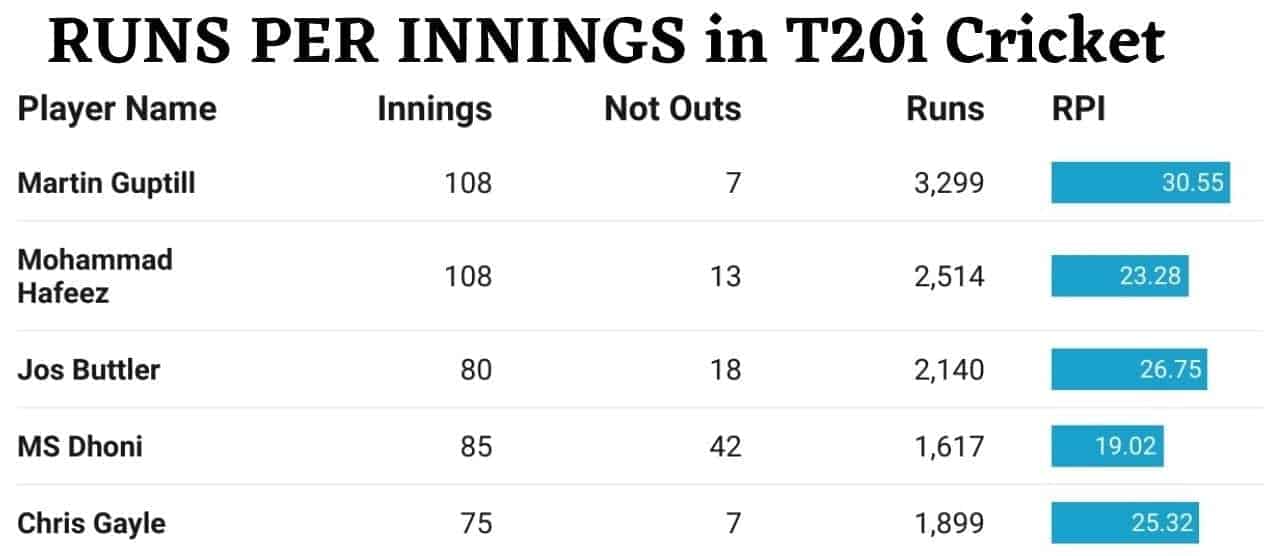
Now, to cover this drawback, we have RPI. So let’s see about the RPI by analyzing the same players again.
Everything About Runs Per Innings (RPI)
Runs per Innings (RPI)= Overall Runs/Innings Played
As visible in the above photo, RPI gave us a completely different overview; Dhoni who has the highest Batting Average among the 5, has the lowest RPI too.
RPI as said Runs Per Innings includes all the innings, even when some like Dhoni, who usually bats at no.5/6, came in the 19th over and faced 2 balls and remain not out.
This metric will use that inning as complete innings; That innings where he gets only 2 balls to play will hold the same weightage as an inning an opener got to play.
Dhoni has 42, not-outs (Most in T20i cricket), which means almost 50% of innings he remained not out.
Many not-out innings of MS are even below 10 scores. RPI will count them as a complete inning and too, as valuable as a completed inning by Martin Guptill, in which he played 60 balls.
So opposite to Batting Average, RPI is quite unfair for middle-order players, especially for finishers as it gives a superior edge to players who usually bat in the Top-Order and have chances of playing more balls.
The above graph shows the difference between the RPI and the Average of these 5 players in terms of %.
Note: The difference between the RPI and the Batting Average of a batsman is directly proportional to his % of not-out innings.
MS Dhoni and Jos Buttler, as they have higher not-outs, got affected most by using RPI instead of averages. Hafeez, as he has moderate not-outs, was not got affected much and Guptill with the least not-outs, got affected by just 6.5%.
Now, as we discussed RPI is totally against the players with a higher % of not-outs, which means it gives an unfair edge to Top order players while comparing.
So, both RPI and Batting average have their disadvantages. So what metric to use which is equally balanced for all types of batsmen?
Weighted Batting Average (WBA), solves the issue here. Let’s deeply understand all the stuff about it.
Weighted Batting Average(WBA): A Fair Approach
So, First, discuss What is WBA?, it is a metric that gives an overview of batsmen’s consistency, without giving an edge to any type of player.
It has a mechanism, in which we have to analyze all the not-out innings and then divide them into 2 categories and then use one category to find the WBA.
How to calculate WBA??
It’s quite simple, you just need some basic things about that player’s career such as Innings played by him, Overall Runs Scored, No. of innings in which he remained not out; All the scores at which he remained not out and his career RPI.
The steps are:
- Include all the innings in which the batsman got dismissed as complete innings (95 in the case of Hafeez)
- Now, also include all the innings in which players remain not out but scored higher than RPI as a completed inning. (10 in the case of Hafeez)
- Now add, all the not-out scores below RPI (13+5+1=19, for Hafeez)
- Divide the resulting sum by RPI. I will call the result “Decay Innings” further in this article.
WBA= Overall Runs/{Innings in which batsman got dismissed + no. of not out scores above RPI+ Decay Innings)
In which Decay Innings= Sum of all not out scores below RPI/ RPI
Now, For example, consider the case of Mohammad Hafeez; He has played 108 innings in T20i cricket; remained not out 13 times, has scored 2514 runs and has a batting average of 26.46.
His not out scores are, 54*, 13*, 42*, 5*, 25*, 32*, 34*, 53*, 67*, 86*, 99*, 32*, 1*.
The RPI of Hafeez is 2514/108= 23.28.
Not out scores that are below his RPI are 13*, 5*, and 1*. Their sum is 19 and when divided by 23.28 (his RPI), will give us the value of decay innings, 0.8.
So, Mohammad Hafeez’s WBA= 2514/(95+10+0.8) = 23.76.
Let’s Consider another example of MS Dhoni, who played a total of 85 innings in which he scored 1617 runs with a batting average of 37.6. 42 times, MS has remained not-out in his T20i career and his not-out scores are:
9*, 10*, 15*, 16*, 10*, 16*, 18*, 0*, 4*, 11*, 9*, 8*, 7*, 7*, 13*, 13*, 15*, 1*, 7*, 0*, 16*, 19*, 28*, 30*, 23*, 48*, 21*, 22*, 23*, 24*, 24*, 22*, 27*, 20*, 20*, 36*, 39*, 52*, 30*, 20*, 29*
Dhoni’s career RPI is 1617/85=19.02
There are a total of 22 innings where he remained not out below his RPI (Bold ones); The sum of all the scores in these 22 innings is 214.
Dividing it with his RPI, we got 11.25=Decay Innings of Dhoni’s career.
Now, MS Dhoni’s WBA = 1617/(43+20+11.25) = 21.77
Nothing can be fairer than the WBA; All innings where the batsman got out are included in the three metrics, but the special thing about the WBA is it includes not-out scores correctly.
The not-out scores above RPI are included because a player has already scored the avg. no. of runs he used to score during his career.
That means it cleared the flaw in the Batting Average, which used to exclude the no. of all not-out innings during calculation.
Now, not out scores below RPI should not be included as complete innings, as sometimes Innings like Kohli vs Scotland where he got to play only 2 balls, are also got included as complete innings.
Agreed that it’s rare for someone like Virat Kohli, who is a top-order player, to have such innings.
But batsmen who generally play at 5/6 can have many innings like that in their career where they got just a moment to bat. (Dhoni having 22 not-out innings below his career RPI, is the biggest example here)
So for these types of innings, a proportion of innings will be included only, just like in the case of Dhoni; We only counted those 22 innings below his RPI as 11.25 innings (Decay Innings) during calculation.
That means the WBA cleared the flaw in RPI, in which all innings are included equally despite whether a player got to play 1 ball or 60 balls.
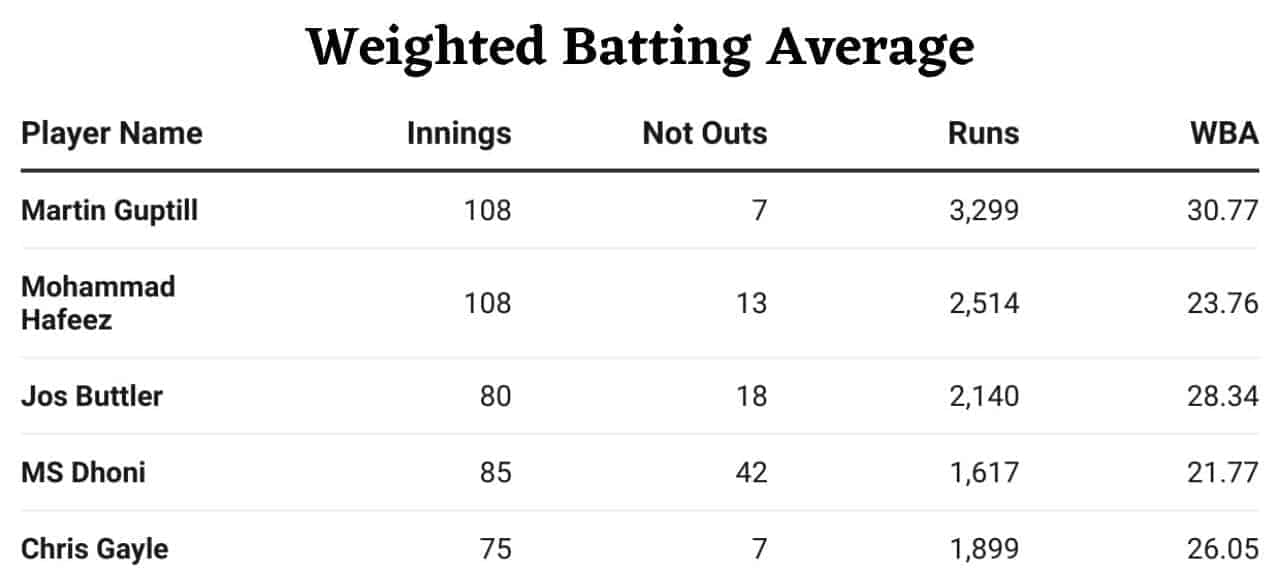
The WBA of the 5 players we discussed in this article is shown in the Table Below:
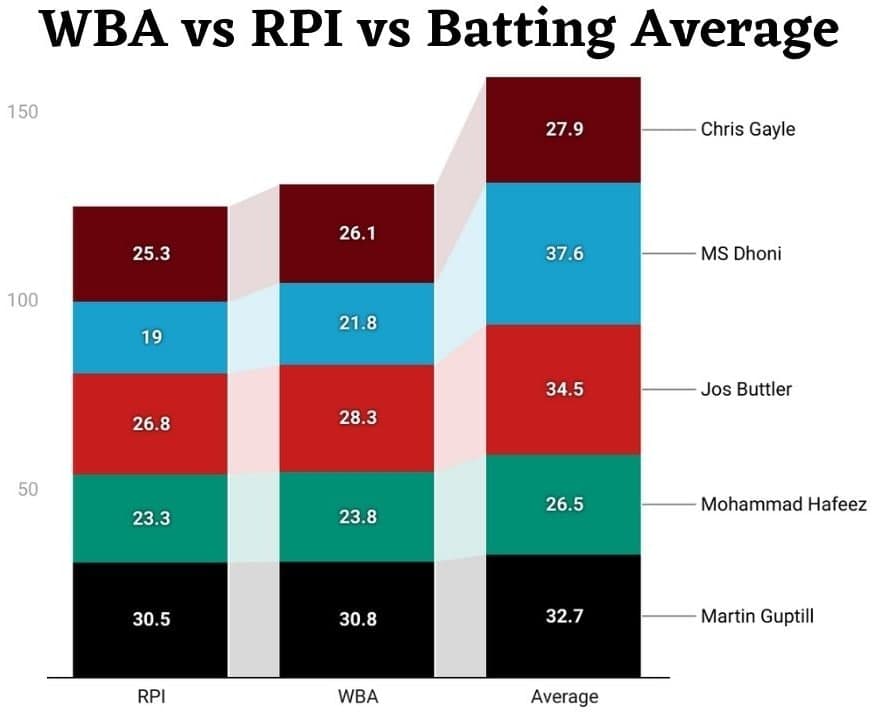
Note: As we are using some not-out innings as completed, WBA will always remain lower than batting average or equal to it, and as we include some not-out innings in proportion and not as complete, WBA will always remain either higher than RPI or equal to RPI.
In simple language, RPI<=WBA<=Batting average will always remain true.
RPI vs WBA vs Batting Average Comparision
The formula for WBA includes most innings almost more than 95% (average case) while division, RPI includes 100% innings and in the case of Batting Average, it generally includes 80-90% innings.
This means the value of the WBA will be closer to the RPI values as compared to the Batting Average value.
The Batting Average, RPI and WBA of these 5 players are also proving our discussed argument valid.
Conclusion
In the beginning, we discussed the 2 basic and mostly used metrics for judging consistency first, and then their drawbacks.
Then introduced you to an advanced and more powerful metric of comparison; Weighted Batting Average.
Discussed everything about it; Hope all your queries regarding WBA are solved after reading this article.
From now on, We will use WBA in all our upcoming articles, especially articles related to T20I cricket.
If you still have a doubt remaining in your mind about WBA, you can ask us in the 24/7 open comments section.
Thanks for Reading!!

