Making this team is one of the most challenging tasks, as numerous legendary players played in this decade, and the hike of most cricketing nations was only in this decade.
We would not select the team solely based on raw numbers; instead, we would consider a mix of useful stats and the players’ impact.
The stats mainly comprise the SENA/I Records of batsmen, Asian records for pacers, etc. Also, a factor is the importance of the player’s contribution to the matches the team won.
The factors which every player of our team must fulfil are:
- 5000+ Runs (For Batsman)
- 200+ Wickets (For Bowler)
We are going ahead with a combination of five specialist batsmen, one batting all-rounder, one specialist Wicket Keeper, three pacers, and a spinner. We have selected One More Spinner as our 12th man.
As we discuss the team in detail, you may scroll down to the bottom if you are just interested in the final XI.
Graeme Smith
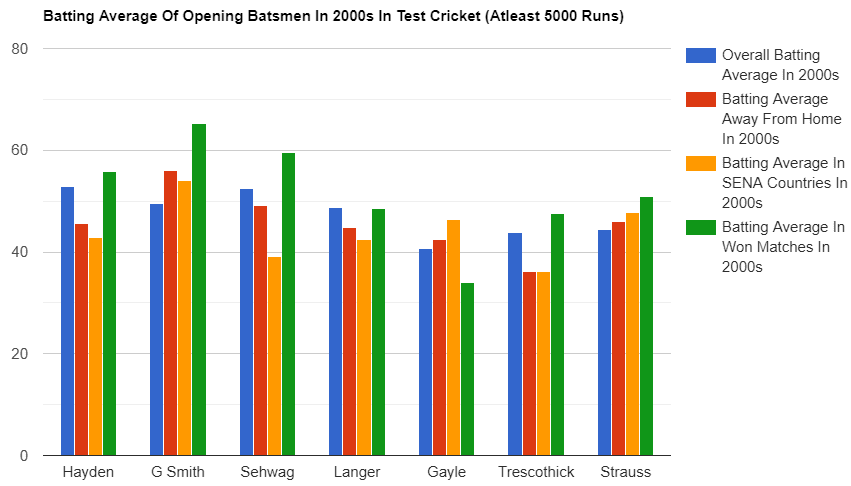
The South African player scored 6451 runs in the 79 matches at an average of 49.62 and has 18 tons to his name.
The opening is one of the most challenging tasks in South Africa, and having 40 plus average is considered good, but GC Smith has scored 2807 runs at an average of 43.18 in South Africa.
Graeme excelled in away matches, scoring 3644 runs at an average of 56.06 as an opener. He has also performed well in Asia, with 2 tons at an average of 48.96.
“South Africa Wins Matches When Smith Performs” was a fact, as Smith averaged a whopping 65.20 in the Matches won by SA, scoring 14 out of his 18 tons.
Smith’s presence would also be valuable as a leader. He is the only captain in Test history to captain a side for 100+ matches, so he is also the captain of our side.
- Graeme Smith’s stats in the 2000s: 139 Innings, 6451 Runs, 49.62 Average, 18 Centuries
- Graeme Smith’s stats away from home in the 2000s: 70 Innings, 3644 Runs, 56.06 Average, 11 Centuries
- Graeme Smith’s stats in IENA in the 2000s: 46 Innings, 2267 Runs, 53.97 Average, 6 Centuries
- Graeme Smith’s stats in won matches in the 2000s: 63 Innings, 3782 Runs, 65.20 Average, 14 Centuries
Matthew Hayden
Matthew Hayden was one of the members of the most prolific opening pair of the 2000s, his partner being Justin Langer.
Matthew Hayden scored 8634 runs [i.e., most by an opener in the 2000s]
Hayden was a master whenever he played in Australia; this can be stated by the fact that he averaged nearly 60 while playing in his home country, but somehow, his average dipped to 45 when he opened the innings away from Australia.
Most of the Australian players found it difficult to score in India. Still, Hayden averaged more than 51 in India, and against India (i.e., BG Trophy), he averaged an astonishing 59.21, but he was mediocre in England And New Zealand with averages of 35 and 29, respectively.
Hayden scored 22 of his 29 Tons when Australia won the match; it depicted Australia’s performance when he performed.
Fact: Hayden has the record for hitting the most sixes (81) in the decade.
- Matthew Hayden’s stats in the 2000s: 172 Innings, 8364 Runs, 52.93 Average, 29 Centuries
- Matthew Hayden’s stats away from home in the 2000s: 79 Innings, 3331 Runs, 45.63 Average, 9 Centuries
- Matthew Hayden’s stats in SENI in the 2000s: 58 Innings, 2316 Runs, 42.88 Average, 5 Centuries
- Matthew Hayden’s stats in won matches in the 2000s: 119 Innings, 5975 Runs, 55.84 Average, 12 Centuries
Rahul Dravid
The next man on our team is the Indian Wall, Mr Rahul Dravid.
In total, he scored 8558 runs in 103 matches he played at an average of 55.
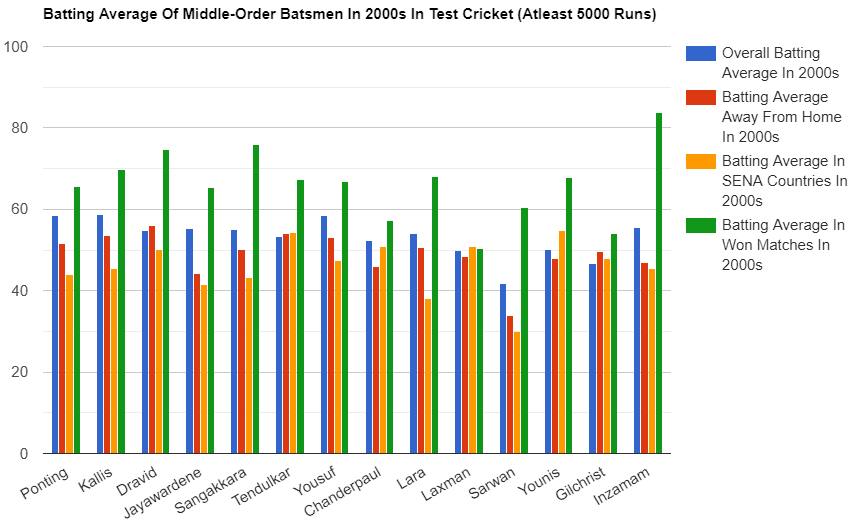
Most Indian batsmen found it difficult to score in England, but it was not the same for The Wall, who averaged 56+ in England. Rahul was excellent in every country, averaging above 56 in away conditions, three more than his home average.
In a total of 10 years, Dravid averaged 60+ 5 times. Moreover, Dravid was one of the most dependable batsmen of Captain Sourav Ganguly, as, under him, he averaged an astonishing 73.31 in 49 matches.
Dravid was involved in one of the most significant test partnerships ever with VVS Laxman, i.e., 376 runs in 2001 against Australia at Kolkata.
India never lost a test match when Rahul Dravid scored a ton in the 2000s; his 11 came in won matches while the other 11 were in the draw.
Fact: Rahul Dravid faced the most deliveries in the decade.
- Rahul Dravid’s stats in the 2000s: 179 Innings, 8558 Runs, 54.85 Average, 22 Centuries
- Rahul Dravid’s stats away from home in the 2000s: 100 Innings, 4875 Runs, 56.03 Average, 11 Centuries
- Rahul Dravid’s stats in SENA in the 2000s: 52 Innings, 2308 Runs, 50.17 Average, 4 Centuries
- Rahul Dravid’s stats in won matches in the 2000s: 63 Innings, 3810 Runs, 74.70 Average, 11 Centuries
Sachin Tendulkar
The next player in our team is labelled as the God of Cricket Mr Sachin Ramesh Tendulkar.
Sachin scored 7129 runs in the decade at an average of 53.20.
Like Dravid only, Sachin was incredible in away tests with an average near 54, nearly two runs per match better than his home average.
Sachin was famous for smashing Australia in Australia, averaging 66+ there with 3 tons.
A remarkable fact is that Sachin was excellent in the 4th test match of the series (mostly decider) as he averaged 87.75 with 3 tons.
There is a common myth that Sachin used to play for his 100(s), and those 100(s) don’t benefit the team, but 12 of his tons in the 2000s were scored in won matches.
Sachin got an edge on Kumara Sangakarra and Mohammad Yousuf just because of his uniform numbers; they both have better overall records but failed miserably in some countries, whereas Sachin was equally good everywhere.
- Sachin Tendulkar’s stats in the 2000s: 150 Innings, 7129 Runs, 53.20 Average, 21 Centuries
- Sachin Tendulkar’s stats away from home in the 2000s: 79 Innings, 3839 Runs, 54.07 Average, 11 Centuries
- Sachin Tendulkar’s stats in IENA in the 2000s: 48 Innings, 2390 Runs, 54.31 Average, 6 Centuries
- Sachin Tendulkar’s stats in won matches in the 2000s: 56 Innings, 3163 Runs, 67.29 Average, 12 Centuries
Ricky Ponting
The player to lead the invincible Aussies is the next in our team. Ricky Ponting is the highest scorer in the decade, with 9458 runs at a GOD-level average of 58.38.
From Australia to New Zealand and from Bangladesh to Zimbabwe, Punter scored everywhere against each nation, but India was the only country where Punter failed miserably. Here, Ponting could manage just 306 runs in 8 matches with a meagre average of 21.85.
Just Like Rahul Dravid, Ponting, too, managed an average of 60+ five times in the decade.
Punter, too, was a batsman who significantly contributed to making the Aussies Invincible. He averaged 65.21 in won matches and scored 24 of his 32 tons in the same.
Fact: Along with the most runs, Punter also has the most fours(1102) and most 100(s) [32] in the decade.
- Ricky Ponting’s stats in the 2000s: 184 Innings, 9458 Runs, 58.32 Average, 32 Centuries
- Ricky Ponting’s stats away from home in the 2000s: 85 Innings, 4125 Runs, 51.56 Average, 15 Centuries
- Ricky Ponting’s stats in IENA in the 2000s: 61 Innings, 2548 Runs, 43.93 Average, 8 Centuries
- Ricky Ponting’s stats in won matches in the 2000s: 122 Innings, 6703 Runs, 65.71 Average, 24 Centuries
Jacques Kallis
What would be your reply if someone asked you about the greatest batting all-rounder of all time? I can’t think of a third other than Sir Garfield Sobers or Jacques Kallis. The latter is part of our team and has scored 8630 runs (second-most in the decade) and has 27 tons to his name.
Kallis is good anywhere in the world, including India, except in England, where he averaged just 22.46. His away average of 53+ depicts his quality. Kallis could be part of this XI solely on his batting record.
Kallis has 15 of his 27 tons in matches RSA won, with an average of nearly 70.
In his bowling, he has 205 wickets, a good bowling average of 32.00, and a total of 4 fifers, including a fifer in Bangladesh (Asia).
Fact: Kallis has the highest batting average (58.70) in the 2000s among players with 2000+ runs in the 2000s.
- Jacques Kallis’ stats in the 2000s: 174 Innings, 8630 Runs, 58.70 Average, 27 Centuries
- Jacques Kallis’ stats away from home in the 2000s: 88 Innings, 3860 Runs, 53.61 Average, 11 Centuries
- Jacques Kallis’ stats in IENA in the 2000s: 48 Innings, 1911 Runs, 45.50 Average, 4 Centuries
- Jacques Kallis’ stats in won matches in the 2000s: 75 Innings, 4259 Runs, 69.67 Average, 11 Centuries
- Jacques Kallis’ bowling stats in the 2000s: 174 Innings, 205 Runs, 32.00 Average, 65.00 Strike Rate, 4 5W hauls
Adam Gilchrist (WK)
No one can think of a second name for a test wicketkeeper-batsman besides Adam Gilchrist.
He will always be the first name whenever an all-time test XI is selected.
Gilly scored 5,130 runs in the 2000s decade, averaging 46+ with 16 tons. He also has a good away average of 50+.
Like Punter, Gilly struggled in India, averaging only 25, but unlike Ponting, Gilly had a test series win in India as a captain in 2003-04. Gilly scored 13 of his 16 tons when Australia won the match.
Gilly played all of his 91 matches as a wicket-keeper and has 362 catches and 35 stumpings to his name.
- Adam Gilchrist’s stats in the 2000s: 129 Innings, 5130 Runs, 46.63 Average,16 Centuries
- Adam Gilchrist’s stats away from home in the 2000s: 62 Innings, 2512 Runa, 50.24 Average, 10 Centuries
- Adam Gilchrist’s stats in SENI in the 2000s: 45 Innings, 1873 Runs, 48.02 Average, 7 Centuries
- Adam Gilchrist’s stats in won matches in the 2000s: 89 Innings, 3892 Runs, 54.05 Average, 13 Centuries
Shaun Pollock
If we talked about the most accurate fast bowlers, Shaun Pollock would be there in the top 5. This man had great success in ODI(s) [In the top five all-time ODI players for me], but his greatness in tests is quite underrated as he is the second-best fast Bowler in the 2000s.
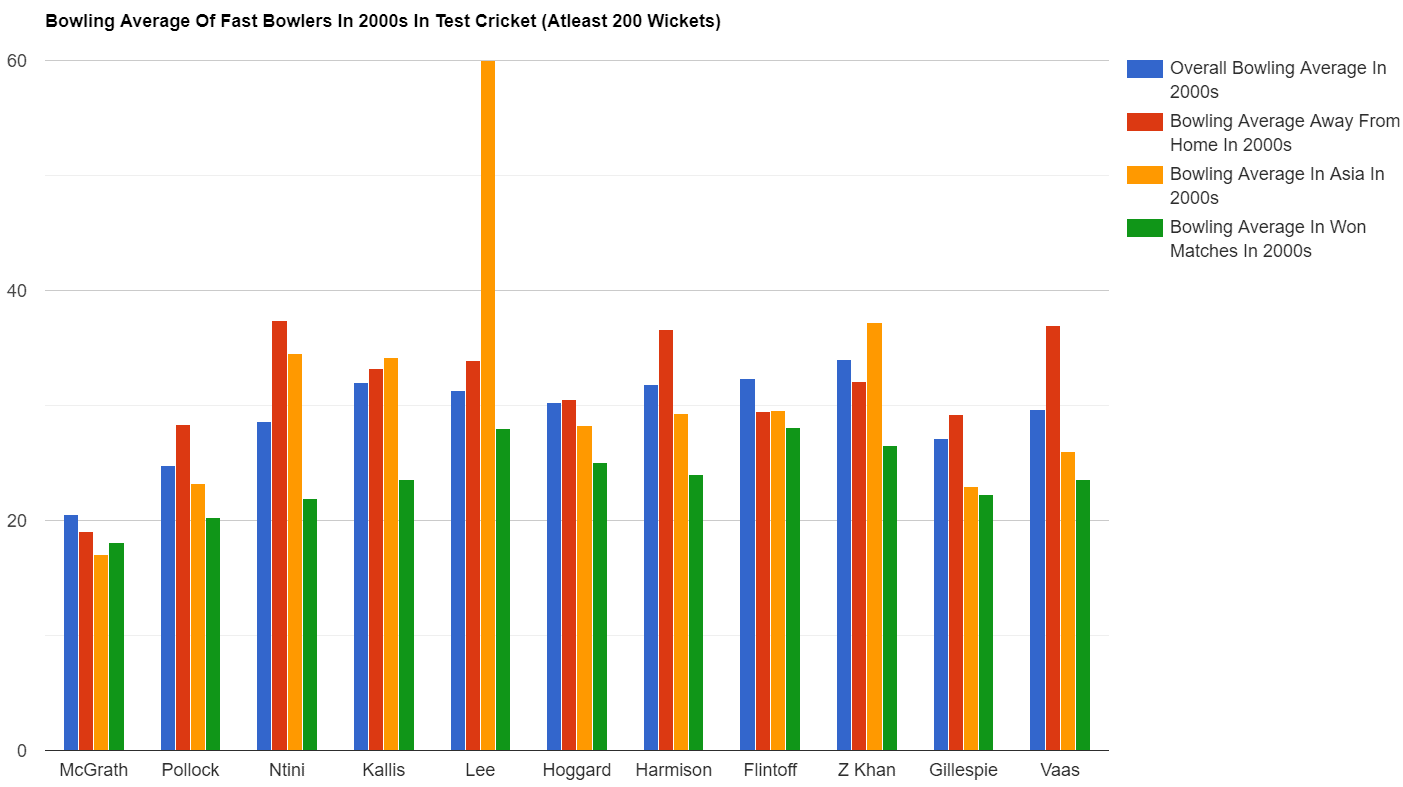
Pollock clinched 250 wickets with a good average of under 25. He had brilliant success all around the globe except in Australia, where he averaged 46+. His away average of 28 is also quite good.
Asian pictures are considered graveyards for fast bowlers, but if someone has control over his bowling, he could perform there too. This is the case for Shaun Pollock, who has 50 wickets in Asia with a good bowling average of nearly 23 with 1 fifer.
Talking about Pollock and ignoring his batting is no less than a sin. His batting numbers are pretty good, with an average of 32.56, and he also has 2 100(s) to his name.
In the matches where RSA won, Pollock averaged nearly 40 with the bat and 20 with the ball. So, in conclusion, Shaun Pollock is an absolute gem as a player.
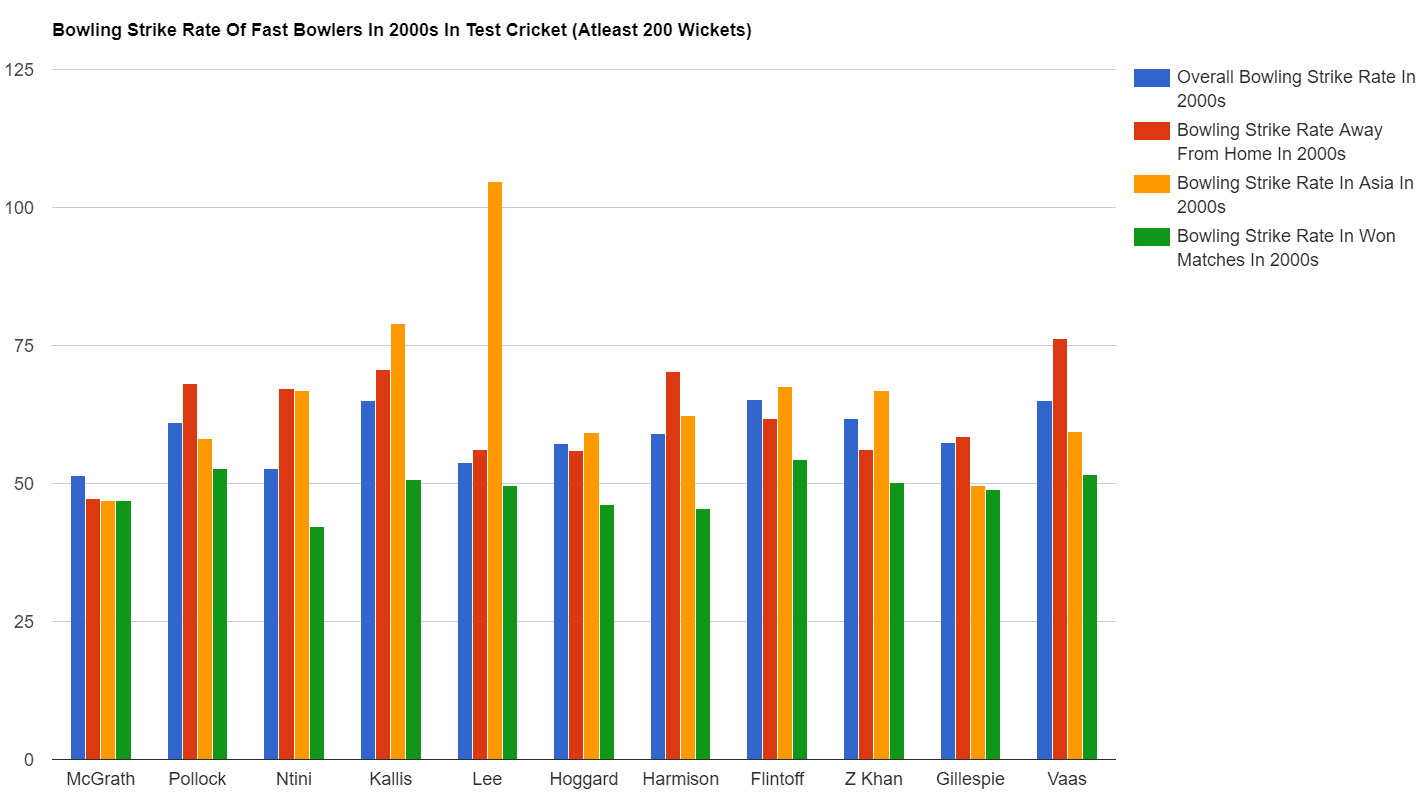
- Shaun Pollock’s stats in the 2000s: 135 Innings, 260 Wickets, 24.76 Average, 61.0 Strike Rate, 6 5W Hauls
- Shaun Pollock’s stats away from home in the 2000s: 35 Innings, 122 Wickets, 28.36 Average, 68.1 Strike Rate, 3 5W Hauls
- Shaun Pollock’s stats in Asia in the 2000s: 14 Innings, 50 Wickets, 23.18 Average, 58.2 Strike Rate, 2 5W Hauls
- Shaun Pollock’s stats in won matches in the 2000s: 32 Innings, 131 Wickets, 20.22 Average, 52.8 Strike Rate, 2 5W Hauls
- Shaun Pollock’s Batting stats in the 2000s: 100 Innings, 2377 Runs, 32.56 Average, 2 Centuries
Jason Gillespie
The next Bowler in our team is Australian “Dizzy”. In total, Gillespie played 57 matches in the decade, in which he clinched 209 wickets at a good bowling average of 27 and had 5 fifers.
His numbers in away matches are not much different, as he averages 29 with 3 fifers.
Gillespie was one of the most lethal fast bowlers in Asia, managing an excellent bowling average of nearly 23 in the 13 matches he played here.
Makhaya Ntini has taken way more wickets (he was the highest wicket-taker as a pacer in the 2000s) than Dizzy in the decade, but the factor favouring him is his consistency all around the globe. Due to this factor alone, Gillespie made it to our final 11, while Ntini could not.
His record in the won matches is excellent, with a bowling average of nearly 22.3, and also, all of his 5 fifers in the 2000s were in the won matches.
On some occasions, this bloke could handle the bat, too, as he scored 201* in the match against Bangladesh in 2005 while playing as a Nightwatchman. (highest score by a Nightwatchman in cricket history)
- Jason Gillispie’s stats in the 2000s: 113 Innings, 209 Wickets, 27.09 Average, 57.4 Strike Rate, 5 5W Hauls
- Jason Gillispie’s stats away from home in the 2000s: 62 Innings, 108 Wickets, 29.18 Average, 58.6 Strike Rate, 3 5W Hauls
- Jason Gillispie’s stats in Asia in the 2000s: 26 Innings, 54 Wickets, 22.96 Average, 49.7 Strike Rate, 1 5W Haul
- Jason Gillispie’s stats in won matches in the 2000s: 78 Innings, 159 Wickets, 22.28 Average, 48.9 Strike Rate, 5 5W Hauls
Glenn McGrath
If accuracy is the art, Pigeon is the artist. He was the most accurate fast Bowler, followed by Curtly Ambrose, Joel Garner, and Shaun Pollock. He is so freaking accurate that he can hit a coin on a pitch all day long.
Glenn McGrath has 297 wickets in the decade with a dream average of 20.53. He failed nowhere in the world, depicted by his away average of less than 20, approximately 2 less than his home average.
For all seven years he played in the decade, he tore away at the batsman with his accurate line and length, not sheer pace.
His numbers in Asia are more than a fast bowler could have dreamt. In Asia, he had 45 wickets with an average of nearly 17.
Australia won 51 of the 66 matches he played, and here he averaged 18.06.
So, undoubtedly, Pigeon is the best fast Bowler in test cricket in the 2000s
- Glenn McGrath’s stats in the 2000s: 131 Innings, 297 Wickets, 20.53 Average, 51.4 Strike Rate, 14 5W Hauls
- Glenn McGrath’s stats away from home in the 2000s: 58 Innings, 141 Wickets, 19.06 Average, 47.2 Strike Rate, 8 5W Hauls
- Glenn McGrath’s stats in Asia in the 2000s: 20 Innings, 45 Wickets, 17.08 Average, 47.0 Strike Rate
- Glenn McGrath’s stats in won matches in the 2000s: 102 Innings, 247 Wickets, 18.06 Average, 47.0 Strike Rate, 12 5W Hauls
Muttiah Muralitharan
Many spinners ruled the cricketing world in their respective era(s), but there is only one GOAT, and he is none other than Muttiah Muralitharan.
Shane Warne’s ball to Mike Gatting in the 1993 Ashes was termed the ball of the century, but deep inside, we all know that Murali delivered hundreds of balls like that.
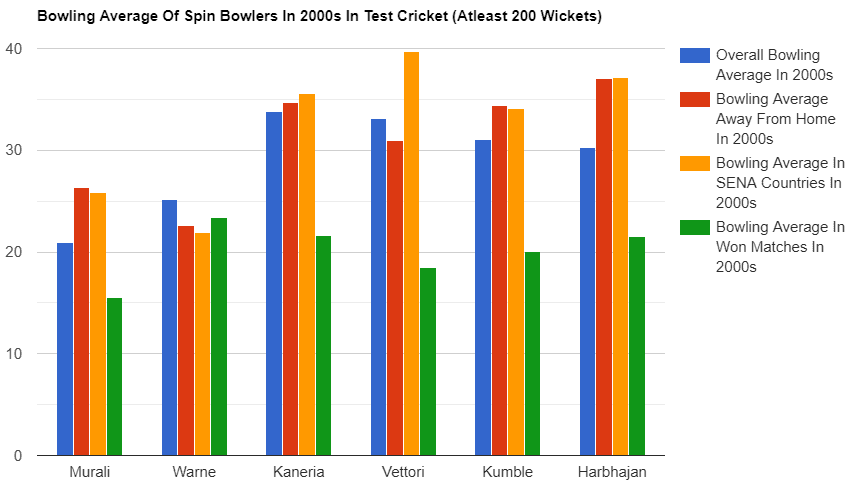
His numbers justify his talent too. He has 565 wickets in the decade, averaging 20.97.
49 fifers in a decade are insane, with Harbhajan Singh from India being second best at 23. Murali also has 20 10-wicket hauls [Shane Warne at second with just 6].
He played 14 matches in SENA and has 77 wickets with a good average of 25.8 and 6 fifers.
32 of his 49 fifers were in the match that Sri Lanka won, and he averaged less than 16 in those matches.
At last, all thanks to his Captain, Arjuna Ranatunga, for saving young Murali’s career when the whole world was against him and Umpire Ross Emerson stopped him from bowling thrice in a short period.
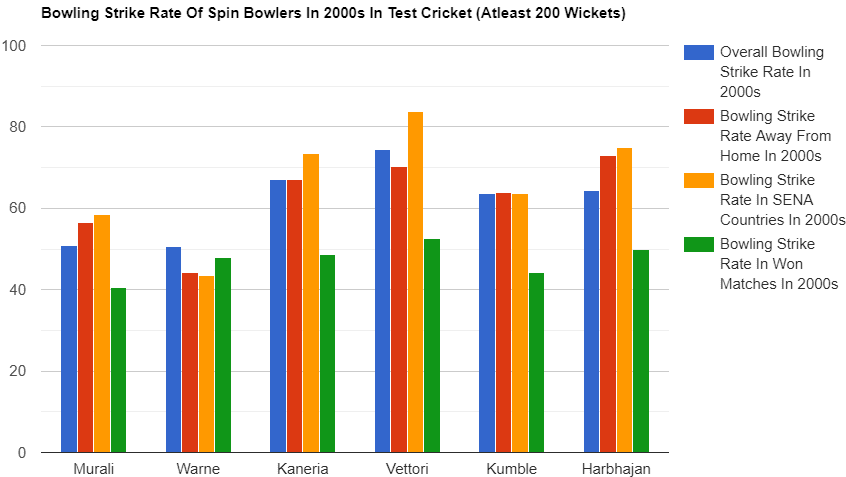
- Muttiah Muralitharan’s stats in the 2000s: 154 Innings, 565 Wickets, 20.97 Average, 50.9 Strike Rate, 49 5W Hauls
- Muttiah Muralitharan’s stats away from home in the 2000s: 61 Innings, 201 Wickets, 26.36 Average, 56.6 Strike Rate, 14 5W Hauls
- Muttiah Muralitharan’s stats in SENA in the 2000s: 23 Innings, 77 Wickets, 25.80 Average, 58.4 Strike Rate, 6 5W Hauls
- Muttiah Muralitharan’s stats in won matches in the 2000s: 78 Innings, 333 Wickets, 15.49 Average, 40.6 Strike Rate, 32 5W Hauls
Shane Warne
Many cricket experts and the game audience consider Shane Warne the greatest spinner ever to play test cricket. Still, I can’t choose between Warne and Murali as a superior bowler.
Warne played mostly on Pace-friendly pitches, but Murali also performed well in these conditions. Murali outplayed Warne in the decade because of a high 208 wicket difference, and Murali’s stats are superior, too.
Warne clinched 357 matches in the decade with an average of 25 and 21 fifers. He played 35 of 65 games outside the home country, has 199 wickets in those with a better average of 24 and has 15 away fifers too.
Warne has played in Australia since childhood, so we are not considering his Australian record here. He has 138 wickets in SEN (South Africa, England, New Zealand) with a great average under 22 and 9 fifers.
Australia won 70% of the matches Warne played in the decade, and in those matches, he has 17 fifers and a bowling average near 23 with 283 wickets.
The 2005 Ashes is considered one of the most remarkable test series ever. Still, many readers might not know that Warne was the highest wicket-taker in that Ashes, with 40 wickets. Taking 40 wickets in a five-match series, that too in England by a spinner, is insane.
- Shane Warne’s stats in the 2000s: 127 Innings, 357 Wickets, 25.17 Average, 50.7 Strike Rate, 21 5W Hauls
- Shane Warne’s stats away from home in the 2000s: 71 Innings, 226 Wickets, 22.65 Average, 44.3 Strike Rate, 17 5W Hauls
- Shane Warne’s stats in ENA in the 2000s: 22 Innings, 138 Wickets, 21.95 Average, 43.4 Strike Rate-43.4, 9 5W Hauls
- Shane Warne’s stats in won matches in the 2000s: 99 Innings, 283 Wickets, 23.37 Average, 48.0 Strike Rate, 17 5W Hauls
So, The Greatest Test XI of the 2000s is:
- Graeme Smith (C)
- Mathew Hayden
- Rahul Dravid
- Sachin Tendulkar
- Ricky Ponting
- Jacques Kallis
- Adam Gilchrist (WK)
- Shaun Pollock
- Jason Gillespie
- Muttiah Muralitharan
- Glenn McGrath
Shane Warne (12th Man)


Well the 11 looks good but the batting position and coordination is not the best. Kallis at no 6 isn't the best position for him to play same for ponting at no 5 .